
[Next post I will return to my series of posts on the theory of Fatigue and Training Intensity. I interrupted that series both because I thought those remaining posts could benefit from more time and because I wanted to address my failure to prepare for a May metric century this year.]
Last post, I developed some tools for looking at my training data. I identified four similar routes that I ride frequently such that my average speed when I ride any one of these routes can be used interchangeably to assess my Form (my ability to ride fast and long which is increased by an improvement in my Fitness and decreased by a buildup of Fatigue.) I refer to rides on these four routes as Alpine-Like rides. For the purposes of this post, I assume my average speed on Alpine-Like rides is a measure of my Form. This may be a bit of an oversimplification but I believe it to be a useful approximation.
In my previous post I also developed some statistical techniques for more objectively examining ride data. In that post, I bemoaned my inability to prepare for The Art of Survival, a group ride I had hoped to attend last May. To understand that failure, I focused on my rides in the months before and used statistics to try to determine if my failure was truly due to a lack of Form (it was.) In this post I am zooming out to look at all the Alpine-Like rides I have completed since moving to California in September of 2017 to see what they can tell me about how I have been training and the impact of that on my Form. The graph at the top of this post shows my average speed on all 231 such rides completed between October 15, 2017 and May 31, 2021.
If you squint hard enough at that graph some trends might be apparent. What is crystal clear, however, is that there is a huge amount of day to day variability and the rides are very unevenly spaced over time. For example, note the very dense cluster of rides during the middle of 2018. It seems I really liked doing Alpine-Like rides back then! The latter has the potential to bias any statistical analysis by giving too much weight to that one time period. Primarily to correct that bias and secondarily to smooth the data a bit I have taken to grouping the data by month. All of the Alpine-Like rides in a given month are averaged and treated as one datapoint. The results of doing that are shown in the blue line in the next graph:

The red line on the graph is a running average of 3 months centered over each month to further smooth the data. When normalized and smoothed in this way, trends become much more apparent. It appears there was a slow increase in my Form after I got to California, but that towards the end of 2018, there was a more rapid decrease. Then, my Form started increasing around May of 2019, an increase that continued until the beginning of 2020 when my Form reached an all time high. That high was so dramatic that it caused me to (incorrectly) speculate that it was due to changes that my local bike shop made to my bicycle, a speculation about which I blogged. That rapid increase in Form was followed by an even more rapid decrease, then another increase followed by a decrease leading to the plateau of low Form that kept me from riding The Art of Survival last May, the plateau that was the subject of my last post.
Except for the calculation of averages, I have not used any statistics up to this point, all my conclusions are based on subjective eyeballing of the data. To a large extent that is because I am not sure how to apply statistics in this case. One significant complication in doing so is that I have looked at the data too much to be able to do a valid statistical analysis of it. This is a very counterintuitive fact about statistics to which many students object but which all professional statisticians agree is true. In order for a statistical analysis to be valid, you have to frame any hypotheses you want to test before ever looking at the data. You can divide the data in half, look at one half, develop hypotheses and then test them on the second half just so long as you don’t revise your hypotheses based on what you see in the second half of the data. What is so counterintuitive about this rule is that the apparently identical analysis done on the apparently identical first and second halves of the data yield invalid and valid results respectively. This turns out to be a consequence of the multiple testing problem I referred to in my last post. If you test 20 hypotheses all of which are wrong, on average one of them will test as statistically significant at the traditional P ≤ 0.05 level. That is, in fact, what P ≤ 0.05 means, there is a one in twenty (5%) chance that the observation is due to random chance. When one looks at a dataset, one's brain is rapidly testing an uncountable number of hypotheses and so will, using the subjective eyeball approach, find a few that look significant but are just due to random chance. You cannot even correct for this because you have no idea how many tests your subconscious brain did. The good news is that there is no reason that those same chance fluctuations will be present in the second dataset at which you have not looked. Unfortunately, I have no second dataset so all of my statistical analyses are suspect. That said, I feel like I am better off doing them than not so long as I do not overestimate my certainty. To further help minimize chance associations, I have started to use systematic analytical approaches to minimize the amount of cherry picking I am doing. One such systematic approach is to always analyze my data by calendar month rather than doing what I did in my last post, selecting an arbitrary group of rides that looked low and then testing that visually identified set with statistics.
That arbitrary calendar month grouping is far from a perfect solution, a month suffers from being both too long a time interval and also too short. It is too long because a lot can happen in a month, interesting transitions can be lost because of where they fall in the calendar. It is too short because some months don't have enough Alpine-Like rides to be statistically significant, a fact that will come up in the analyses below. However, it was the best solution I could think of to remove some of the subjectivity of my analyses.
To take advantage of my monthly summary data I used a 1 sample T-test to ask for each of the months I have been in California if my average speed on Alpine-Like rides for that month was significantly different than my overall average speed of 12.26 MPH. As I noted in my last post, this suffers from the multiple test problem. If you do enough comparisons, you will see "statistically significant" differences that are due just to chance. For that reason I will be using corrections to avoid that.
Since moving to California, I have ridden for 44 months. I decided that I wanted to have at least 4 rides in a month to compare its average speed to the overall average. When I removed months with fewer than 4 rides, there were 27 months left to compare and 5 of those were significantly slower or faster than average. The uncorrected probabilities that these differences are due to chance are P=0.00051, P=0.00173, P=0.00259, P=0.01265, and P=0.01298. I used the Holmes correction from The Primer of Biostatistics, the book I mentioned in my last post, to correct for the 27 comparisons I did to find those three apparently significant ones. When I did that, only the two most significant differences (one faster, one slower) remained significant at the P=0.05 level. The third was significant at the P=0.06 level, I cannot be 95% sure it is real but I can be 94% sure. For the last two I can be 75% sure they are real, more likely than not they are but they need to be taken with a grain of salt. There are other reasons for thinking that these 5 are all real (they are found in parts of the graph where the surrounding months are similarly fast or slow, for example) and similarly, it is almost certainly true that there are additional months that are significantly faster or slower as well but both noise in the data and lack of a sufficient number of observations prevent them from reaching statistical significance.
Interestingly, only one of the five months I found was faster than average. Based on my eyeballing of the data, that surprised me. When I looked at months that I expected to be faster, I found that, in most cases, the reason they were not found is that they contained fewer than 4 Alpine-Like rides. This suggested to me that fast rides might be due more to reduction in Fatigue from less riding than increase in Fitness due to more. However, just because I did fewer Alpine-Like rides doesn't mean I did less riding. There are many other routes I ride (though none of them often enough to be used to assess Form) so I added minutes ridden per month on all rides to my monthly summary data and plotted that against ride speed with the significantly faster or slower rides flagged:
The blue line is my average ride speed for the month, the dotted red line is my total minutes of riding for the month on all routes, and the significantly faster or slower months are flagged with a yellow dot. To my eye, there is no relationship whatsoever between minutes ridden and speed. Of course, minutes ridden is a massive oversimplification of training load; a minute in Training Zone 6 is entirely different from a minute in Training Zone 1 (6 is hard and fast, 1 is slow and easy.) I tag my rides as Easy, Pace/Long, and Brisk, and considered giving them different weights based on that but decided that was much too subjective and in the end I would just be playing with the data to get the answer I wanted. If I want to go to that level of sophistication, I think I would need to start riding with a heart rate monitor again. The reason I was willing to do the analysis that I did, assigning all rides equal weight, is that I am not specifically doing interval training at present, I ride all my rides at a similar more or less comfortable pace, so assigning them the same weight might make some sense. I am not totally comfortable with this argument, I think hillier rides leave me more tired and I have considered doing some sort of “feet of climbing” correction. Also, recovery rides I do on my trainer are, by design, much easier, though subjectively I feel that they do produce some Fatigue. However, for the moment, I think equal weight is the best I can do.
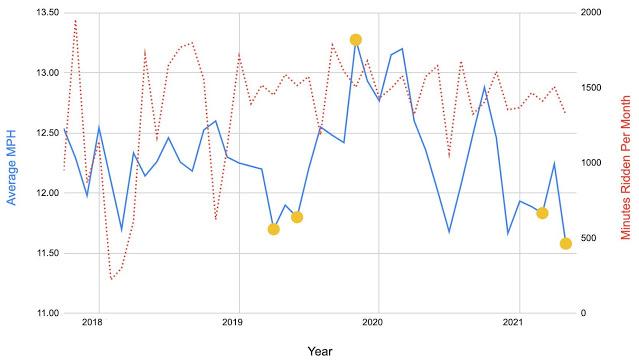
The last graph is similar to the previous one except rather than flagging significantly fast or slow rides, I flagged the metric centuries for which I prepared:

The red dots are The Art of Survival, the gold dots are Golden Hills, the blue dot is a solo metric century I did here on the peninsula, and the green dot is not a metric century but flags the month in which I had my all time fastest Alpine-Like ride, ridden at 14.1 MPH. The most recent red dot flags is the only metric century for which I prepared but did not ride, the 2021 running of The Art of Survival. This figure strongly supports my decision not to attend that ride, my Form was at an all time low, much lower than for any of the metric centuries I did ride. Again, minutes of training doesn't appear to have anything to do with Form at the time of the ride. Things I do note by eyeball are that both times I rode Art of Survival and Golden Hills, my Form at the time of the Golden Hills ride was better. During the 2019 season, this trend seems to have continued. One month after the Golden Hills metric century I rode a solo metric century and my Form was even better. An accidental observation is that three months after that solo metric century, I ended up riding my fastest ever Alpine-Like ride.
I am at a loss to explain any of my observations above and in fact worry that there is a chicken and egg confusion in my thinking. Suppose my training does not determine my Form, but rather, my Form determines my training? Maybe when my Form is good I feel good and I ride harder. But then what is determining my Form? I confess I haven't a clue. I would like nothing better than to have a repeat of my 2019 season (even though my Art of Survival that year was utter misery) but haven't a clue how to do that. Maybe it is just out of my hands. Maybe I just have to take my Form as it comes, relax when it is low, and go for it when it is high. If so, that would again validate my decision to skip The Art of Survival this year. Still, I somehow have to decide what my weekly ride schedule should be. Last post, I mentioned that when I looked back at my subjective description of how I felt it didn't seem to be of much use, it didn't seem to correlate with Form or anything else. Maybe the problem is not with my subjective sense of Fatigue but how I record it. Maybe what I am doing is just fine, riding harder when I feel better and easier when I don't.
One change I am making, at least for the moment, is to ride a bit less in general and to relax what had been my fierce determination to ride at least 300 minutes a week and at least 4 rides a week. (obviously this is based on the assumption that I am riding too much rather than too little, an assumption I can neither justify nor refute, but which my "gut" tells me is true.) One thought that keeps coming back to me is that I am under-appreciating the impact that hills have on my training load. When I moved to California from Texas in 2017, my rides became much hillier. When I moved from San Carlos to Emerald Hills in 2020, they became even hillier. Where did I come up with the idea that I should always ride at least 300 minutes a week? The medical community recommends 300 minutes of Moderate aerobic exercise a week or 150 minutes of Vigorous aerobic exercise a week. The definitions of “Moderate” and “Vigorous” are many and varied. Based on those, I had been assuming that my rides represent a Moderate intensity of exercise. I have recently been reconsidering that and wondering if Vigorous intensity is a better description of my rides. More than that, there are the results in the paper Gillen et al. that I refer to so often. It argues that High Intensity Interval Training counts much more than even Vigorous exercise; that 6 or 7 minutes a week of all out sprinting would be enough to satisfy my medical needs. During the course of many of my rides (including the Alpine-Like rides) there are hills that really leave me panting. These climbs are probably less than the all out sprint evaluated by Gillen et al. but they are way beyond Vigorous. Thus, although it is hard to be sure exactly how to count my rides against the Medical recommendation, I am comfortable about relaxing the 300 minutes a week I had been trying for. As for the 4 ride a week recommendation of the coaches, to discuss all the reasons for reconsidering that would be a post in and of itself, but for many reasons, I am comfortable relaxing that minimum requirement as well. Will this reduction in riding help or hurt? Stay tuned to find out.