Friday, December 3, 2021

Modelling Fitness, Fatigue, & Form

Using Banister’s model^ to predict how Fitness, Fatigue and Form will change over time. To generate the above graph, a training schedule was defined consisting of a ride generating a Load of 1 (in arbitrary units) to be ridden for 200 days and then training is stopped. At first, Fatigue dominates Fitness and Form (the ability to perform on a ride) falls. Then, Fitness dominates Fatigue and Form increases. When training stops, because Fatigue decreases faster than Fitness, Form increases. This is the reason that the taper period right before an event is so common in training plans.


In my last post I wondered if I had been training too hard. One way to avoid that would be for me to monitor my training load (hereafter Load) to see if it is increasing, decreasing, or staying the same. If treated with full rigor, measuring that Load would be an impossibly complex task, so we all find simplifications for estimating Load that are better than nothing, or over time, better than we were doing before. I have, in fact, gone the other way, partially out of necessity (the hills where I live make it harder to ride at a fixed intensity or to estimate the overall intensity of a ride) and partly out of an attempt to simplify my life (when my heart meter broke, I didn’t bother to replace it.) Now and again, however, I regret that and wonder if it would be worth the effort to better track my rides. At present, the only way I am estimating my Load is to record the minutes of duration of each ride. Even that is better than nothing, but when I wonder if the increasing hilliness of my new neighborhood is throwing off my estimates it makes me want to do more. The first step in doing more would be to acquire a power meter or a heart rate monitor. That device, along with some basic software would allow me to characterize a ride in terms of minutes in Zone 1, minutes in Zone 2, etc which is better than just total minutes. If I had been doing that over the last couple of years and had noticed that my total minutes of riding stayed the same after I moved but that the zone distribution moved to more time in higher zones, that would already tell me I had increased my Load. To make that quantitative rather than qualitative, I would need to estimate the relative Load produced by different zones, something I have blogged about a fair bit and thus feel like I know how to do. The purpose of this post is to discuss the next step after that, to model the competing impacts of my training load on Fitness and Fatigue and how they play out over Time.

The inspiration for this post came while I was preparing my post on Sweet Spot Training. I was listening to a podcast by Frank Overton, the person who coined the term Sweet Spot, and he talked about how motivating it was to use modelling software to track the accumulation of fitness resulting from his training. I am very motivated by tracking my training and I found the prospect of incorporating this new kind of tracking very tempting. In order to figure out how I might do that I began exploring the training models that are used to do so, and thus today’s post.

The reason training increases performance (Form) is because the Fatigue generated by training goes away faster than the Fitness generated by that same training. That is the basis of the training models I will be talking about. It is more complicated than that; there are different kinds of Fatigue and different stages in the recovery from Fatigue and the Fitness generated by training doesn’t appear immediately but only over time, thus the truism that you don’t get stronger during training but during the rest after training. The models I will be talking about simplify things by ignoring some of that complexity.

I am aware of two models for estimating Fatigue, Fitness, and Form, the model developed by Dr. Andy Coggan (available as part of the widely used Training Peaks commercial software package) and that developed by Dr. Eric Banister^. Both of these models do two things. First, they estimate the Load generated by a ride based on how much Time during that ride the athlete spends at different power output levels or heart rates (respectively) and then assigns to each of those an Intensity score. Higher power or heart rate corresponds to higher Intensity but not necessarily in a linear  way; a doubling of power or heart rate can result in a much greater than doubling of Intensity. Because I have blogged about the calculation of Intensity a lot, I won’t discuss it in this post. Rather, I will assume that given a power output level or heart rate an Intensity can be calculated. As just one example of how to do that, I offer the following equation* for calculating the Intensity of some of my rides from the Heart Rate (HR) measured on those rides:

Intensity = .000428 x e(.0656 x HR).

Load corresponds pretty directly to how tired the athlete is after a ride. If an athlete knows the  Intensity of a ride, converting that to Load is straightforward:

Load = Intensity x Time

For a ride at constant Intensity, it really is that simple. For a realistic ride during which Intensity varies, it is still pretty simple but there are a couple of different ways of making this calculation. The good news is that they all give pretty similar results, it is mostly about which is the most convenient. For example, back when I was tracking my rides with a Garmin heart rate monitor, a Garmin bike computer, and Garmin software, I could have taken the amount of time spent in each heart rate training zone provided by that software, use an average Intensity for each zone, and sum up the five Intensity x Time values to get a total Load for the ride. But how does Load relate to Form, Fitness, and Fatigue? Both Fitness and Fatigue result from the accumulation of Load over many days of training on the one hand and the reduction of both Fitness and Fatigue that occurs during the time after that training. In other words, Load pushes both Fitness and Fatigue up, Time pulls both Fitness and Fatigue down. Expressed as equations, the effects of Load and Time are:

Fitness = ( Fx(Load on Day 1, Time since Day 1) + Fx(Load  on Day 2, Time since Day 2) + … +
      Fx(Load on Day N, Time since Day N) )

Fatigue = ( Fy(Load on Day 1, Time since Day 1) + Fy(Load  on Day 2, Time since Day 2) + … +
      Fy(Load on Day N, Time since Day N) )

...where Fx() and Fy() are functions that reduce the impacts of Load on Fitness and Fatigue for older rides; that epic ride I did ten years ago isn’t doing me much good anymore. Fx() is slower than Fy() such that an athlete loses Fatigue faster than they lose Fitness. As a result, training eventually produces a net increase in performance.

Finally, the following equation is used to model expected performance (Form):

Form = Fitness - Fatigue

Note that Intensity, Load, Fatigue, Fitness, and Form have no natural units. However, due to the above equation, the units for Form, Fitness, and Fatigue all need to be the same. What is commonly done is to first assign some constant to relate Load to Fitness and Fatigue. In the Coggan model, one unit of Load is defined as producing one unit of both Fatigue and Fitness. In the Banister model, one unit of Load produces one unit of Fitness, but two units of Fatigue. In both models, one unit of Form, Fitness and Fatigue are defined to be equal.

The interesting part of both models is how Fitness and Fatigue decrease over time, the functions Fx(Load, Time) and Fy(Load, Time) in the above equations. I confess that I do not understand the Coggan model. Using equations available on the Web, I get nonsensical outputs. Thus, from here on out, I will focus on the Banister model. In this model, both Fitness and Fatigue decrease exponentially with Time as per this equation:

Fitness = M1 x Load x Time x e(-Time / T1)

Fatigue = M2 x Load x Time x e(-Time / T2)

...where:

M1 is the relative iMpact of a given Load on Fitness. By default, this is set to 1.

M2 is the relative iMpact of a given Load on Fatigue. By default, this is set to 2; the initial impact of a ride on Fatigue is assumed to be twice that on Fitness.

T1 is the Time in days it takes for the impact of a ride on Fitness to decrease to 37% of its initial impact. By default, this is set to 45 days.

T2 is the Time in days it takes for the impact of a ride on Fatigue to decrease to 37% of its initial impact. By default, this is set to 15 days.

Time is the time in days since the ride.

Let’s see what this model predicts for some hypothetical scenarios. The figure at the top of this post describes a very unrealistic scenario the point of which is to illustrate the main features of the model. In this scenario, a ride with a Load set to an (arbitrary) value of 1 is done every day for 200 days and then training  is stopped. The Banister Model correctly reproduces the premise behind periodized training: training increases both Fitness and Fatigue, and at first, performance (Form) decreases due to Fatigue, but over time, the Fitness dominates and Form increases. If training stops, at first Form increases because Fatigue is lost faster than Fitness. This is the rationalization for tapering (reducing training) before an event. So far, the model seems good, but let’s apply it to some more realistic scenarios. I have selected the training plans offered by Coach John Hughes to prepare for a first 200 kilometer long ride and then to allow repeating that ride every month. I have modified these plans to scale them down for a 100 kilometer (Metric Century) ride.

I have added a fourth curve to the above graph, one showing the Load generated by the training plan. The three biggest peaks on the graph are the three long training rides, each increasingly longer, used to get ready for the Metric Century. The graph stops the day before that event. We can see that each of the long rides produces a peak of both Fitness and Fatigue but because the increase in Fatigue is greater, Form decreases in the days after that hard ride. However, it increases thereafter because Fatigue goes away faster than Fitness. Training tapers (decreases) just before the Metric Century and we see that Fitness levels off but that Fatigue falls and as a result the all-important Form continues to increase, reaching a maximum just before the event. This is exactly what is expected for a well designed training plan, and again, the model seems to capture it fairly accurately.

The final curve is for the scenario I so laboriously derived on this blog some time ago, a training plan to maintain the Form to be able to ride a Metric Century every month:


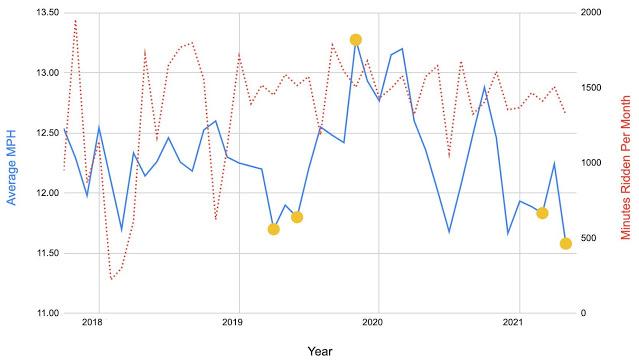
In this graph I added trendlines in order to emphasize that this is a maintenance schedule designed to keep Form relatively constant between the monthly Metric Centuries, those Metric Centuries being not only the goal of but also a critical part of the training plan. I plotted three monthly cycles, starting the day after a Metric Century and ending two days after the third Metric Century. Once again, the model seems to reconstruct the intent of the training program fairly accurately.

In summary, the Banister model (at least) seems pretty good. Of course, it does not do everything. For one thing, it allows you to input training schedules that no sane person would design and that nobody but Superman could follow. There is no limit on the amount of Load that can be completed, the amount Fatigue that can be tolerated, nor the amount of Fitness that will theoretically result from such a suicide schedule. Similarly, it does not model the notion of working up to a goal, like the 20% biweekly increases in mileage I use to work up to a Metric Century. According to this model, an athlete can just jump right into the longest training ride, repeating that until enough fitness has been built up. I see these as reasonable and expected limits as to what the model was designed to do. I think what Banister had in mind when he created the model is that it is up to the coach to plan a good training schedule and that the model is just one more tool to be used judiciously by the coach in service to that effort. Finally, I assume that part of a coach using this model would be adjusting the parameters to fit the individual athlete.

I would like to mention one additional limitation of this model, a limitation that impacts this whole way of thinking about training. This limitation is that the model defines Fitness as a single thing when it is obvious that it is not. The world of road racing provides a clear example of this. Road racers can be classified as climbers, sprinters, time trialists, etc., each needing to build a different collection of different kinds of Fitness. Coach Joe Friel in his classic book “The Cyclist’s Training Bible” describes three basic and three advanced kinds of fitness, each one needing its own training plan to be developed. These are Endurance, Force, and Speed and then Muscular Endurance, Anaerobic Endurance, and Power, respectively. And all of this is just within the narrow specialty of Road Racing. Does this negate everything above? I hope not! What I hope and believe is that the approach I am outlining here applies similarly to all these different kinds of Fitness, and that in fact they may be interchangeable. That is, a coach builds a training plan to address all the different kinds of Fitness a particular cyclist needs to meet their goals but common to them all is the tradeoff between Fitness (of any kind) and Fatigue described by me in this post and modelled by Banister.

I would like to end by explaining how I imagine this tool could be useful. Although it is far from clear I will ever do this myself, I will nonetheless use myself as an example to explain how I think this might work. Right now, I am only tracking ride time. This completely ignores the possibility that one 60 minute ride might be much harder (generating both more Fitness and more Fatigue) than another. If I were to purchase a heart rate monitor and/or a power meter, I could calculate the Intensity of those rides allowing me to account for such differences; I might find that one 60 minute ride generated twice the Load as another, for example. What would still be missing is the effect of Time. Have I rested long enough to recover from a hard ride? Have I rested too long so that I have lost the fitness that ride gave me? The value of Banister’s model would be to help me answer such questions. Will I ever do this? I have no idea, stay tuned.


^ “Modeling Elite Athletic Performance” by Banister, Eric W. in “Physiological Testing of the High-Performance Athlete, Second Edition” 1982, Published by Human Kinetics Publishers (UK) Ltd. Rawdon, England. ISBN 0-87322-300-4

* I derived this equation by using Google Sheets to plot the Intensity values for Hughes TRIMP, described in my most recent post on intensity and then to fit them to an exponential function. This is the equation Google Sheets fit to the plot. 


Tuesday, November 9, 2021

My Recent Training

My recent training schedule showing reduced mileage. The last column labelled “ave min/wk” is my  minutes per week averaged over the last year. My heart broke when that sank below 300. Note that the last time I rode my 33 mile "New Alpine-CaƱada" ride was on 6/30/2021.


Four months ago, I posted "One change I am making, at least for the moment, is to ride a bit less in general and to relax what had been my fierce determination to ride at least 300 minutes a week and at least 4 rides a week." That decision was based on my tentative conclusion that my declining performance was due to an accumulation of fatigue, that my previous training schedule produced more load than my body could tolerate. How did that go? In short, the jury is still out, but I did learn enough that I thought it was worth an update.

Let me start by acknowledging an elephant in the room. I am a very bad patient of my medical care team, missing many office visits and diagnostic screenings. Thus, my poor performance could well be due to an illness that has not been diagnosed due to this negligence. However, I have nothing useful to say about that at this juncture, if I ever drag my negligent ass to the doctor, I will tell you what I find out. Short of that, if not an illness, what is it that is holding back my performance?

“What is holding back my performance” might be a combination of things, so the following list should not be seen as exclusive, a mixture of them might be the culprit. That said, here is my list:

  1. Because of the hills where I live, I might be training harder than I think I am and thus training too hard.
  2. Instead, the opposite might be true; I might be giving up too quickly and not training hard enough.
  3. My performance might not actually be decreasing, or perhaps not as much as I think. What I am looking at might just  be normal variation.
  4. Maybe I am just getting older.

My latest training was designed to both test and respond to possibility 1, the hypothesis that I have been training too hard. The changes I made were 1) to stop riding my longest ride, a 33 mile/160 minute ride with 1,600 feet of climbing and 2) to listen to my body and either not ride or do easier rides when my legs feel tired, even if that means failing to reach my previous goal of 300 minutes of cycling each week. I do confess that letting go of the 300 minute a week minimum for minutes per week of cycling has been both heartbreaking and discouraging but the logic for doing so is that the hills around my new home make my average ride closer to the vigorous intensity aerobic exercise of the Medical Community than to the moderate intensity I had been assuming so that what I should be shooting for, now that I am riding from my new home, is a minimum of 150 minutes a week.

Earlier, I had made a third change, not in response to this latest slump, but one which is helping me respond to it. That change is to set up my trainer in my bedroom. When I first moved into my new home I noted that finding an easy ride was difficult. My first solution was riding laps around a local recreational lake, a ride I call the Lake Loop. Although that ride is easier than some of my other rides, getting to and from there still involved some significant hills. Looking back at my training log I noted that I rode my last Lake Loop ride on December 1 of 2020 and my first Trainer ride on December 11. Thereafter, 30 minutes on my trainer (boredom prevents anything longer) has replaced 60 minutes of laps around the Lake as my easy ride. These new easy rides are much easier and thus have much less risk of contributing to overtraining.

How is my new, easier schedule working? It is probably too soon to tell, at least with any certainty, but one preliminary data point suggests that overtraining was at least a factor in my recent slump. I first noticed this slump in May of this year when I could not complete the training plan I had devised to prepare to ride the Art of Survival Metric Century. (I will comment on the wisdom of that training plan later in this post.) After taking it a bit easier during June, July, and August, my times on my benchmark Alpine-Like rides increased from below average to just above average in September. In October, an out of town trip and a cold severe enough to keep me off the bike meant I had too few Alpine-Like rides to judge, so I have no confirmation of that improvement. A warning against overinterpreting this one good month comes from the fact that I also had a good month the previous April for no reason I can fathom. Was April a statistical outlier? If so, could September be one also? It definitely could, which is why my caution in coming to a conclusion, but I did find my September results encouraging.

What should I do now?

  1. Confirm that by reducing my riding I am improving my performance.
  2. Continue at a reduced level of riding until my accumulated fatigue is gone.
  3. Develop a schedule I can maintain from my current home.
  4. Develop a schedule to prepare for metric centuries.

I have been giving some thought to item 4. Some time ago I devoted a whole post to working from a schedule given in “Distance Cycling” by John Hughes and Dan Kehlenbach to allow riding a century or 200K "every month of the year” and modifying it for a metric century a month, taking into account the rides I can actually do here in the hills of California. One step in that conversion was to increase the mileages I initially calculated to make sure I maintained 300 minutes a week of riding. Now that I am questioning that number, it may be time to reconsider those increases and similarly for the somewhat different schedule to get ready for the first metric century of the season. When I looked back on the actual preparation I had done for metric centuries in the past, it was less than I had remembered and less than the plan I had so laboriously developed, another reason for cutting back a bit on my metric century preparation schedule. Of course, if my recent problems preparing for a metric century resulted from illness or old age, then none of this will be effective. Back when I reviewed my last 40,000 miles of riding, I considered a more general version of that possibility and I asked the following question: "Will the Zombie make it to 50,000 miles, and if he does, what cycling adventures will he have enjoyed?" Stay tuned to find out.


Monday, October 18, 2021

What Is Sweet Spot Training?


This is the classic Sweet Spot diagram. It is not a presentation of experimental data but rather it is a cartoon illustrating the concept of Sweet Spot. That is, training at higher intensities provides increased benefit per minute but cannot be sustained as long. The concept (which remains to be demonstrated) is that the combination of these two results in a “Sweet Spot” of intensity where the total benefit is at a maximum. 


Polarized Training and Sweet Spot Training are sometimes seen as competing training philosophies. Dr. Stephen Seiler coined the term ‘Polarized Training’ and Frank Overton the term ‘Sweet Spot Training’ but in both cases many others have adopted these philosophies so there is considerable variation in the actual training plans that are derived from each of them. That said, I am going to concentrate on Seiler’s and Overton’s versions of these philosophies. Back in the blog post where I described my discovery of Seiler I also mentioned that my first exposure to Seiler was my first experience getting training information from a podcast and that this medium had a number of advantages as a source of learning. So, in addition to concentrating on Seiler and Overton, I am going to rely primarily on their podcasts because these tend to be more flexible and realistic, giving me, I feel, a better sense of what these different philosophies are in the real world. I am not going to attempt to reference each point I make, rather, I am going to give a couple of general references to Overton podcasts at the end of this post^. (I have previously referenced Seiler podcasts.) Finally, there is a third name I need to mention, Dr. Andrew “Andy” Coggan. Dr. Coggan was one of the pioneers of the use of power meters in training and back around 2004 gathered together a group of athletes, coaches, and scientists to develop systems for using power meter data, a group including Overton, and it was the discussions of this group that Overton used to develop his concept of Sweet Spot Training.

The first thing we need to consider is the similar, specialized audiences for these two philosophies. What these audiences have in common is that they are bicycle racers, road racers in particular. (Later in this post I will discuss some differences in their audiences.) I realized this when I attempted to map these philosophies onto the training advice of the coach I use, Coach John Hughes. To my surprise, I couldn’t do it. What I realized is that Hughes writes mostly for participants in distance challenges, century riders and randonneurs for example. Training for these riders is much more about building endurance than speed. It is not that speed does not matter, but rather that speed is secondary to endurance and that the relevant speed is steady state speed, jumping to join a breakaway or having a sprint at the end of the ride is unlikely to be useful to the riders Hughes coaches. This results in very different training plans than those used by road racers.

So what is Sweet Spot? I have mentioned it before as an Intensity Zone used by Coach Hughes. His basic definition of intensity zones divides intensity levels into seven zones. On top of that basic system, he defines Sweet Spot as extending from the very top of his basic Zone 3 through the bottom half of his basic Zone 4. (For the remainder of this post, when I refer to an intensity zone, I am going to be using the Hughes seven zone system.) Overton defines the intensity level of Sweet Spot more broadly, as 84% to 97% Functional Threshold Power (FTP) which translates to the top half of Zone 3 and almost all of Zone 4 in the Hughes system. Coggan has an even broader definition which includes everything from the top of Zone 2 through the very top of Zone 4.

Sweet Spot is an intensity zone but it is also something more. To put this “something more” into context, both the Sweet Spot and Polarized philosophies have in common a firm commitment to periodized training. A minimal version of race-directed periodization is a Base phase during which aerobic fitness is developed followed by a Build phase during which specific racing adaptations (speed, power) are developed followed by a Taper phase in which a small amount of Fitness is sacrificed to substantially reduce Fatigue in order to maximize performance (Form) followed by the race followed by recovery. The period in this process where the difference between the Sweet Spot and Polarized philosophies is important is during the Base phase. The simplest description of the difference between Sweet Spot and Polarized training is that Polarized training recommends many hours of Zone 2 riding during the Base phase whereas the Sweet Spot philosophy recommends fewer hours of the more intense Sweet Spot intensity training during the Base phase. Both are intended to build an aerobic base and the primary argument between these philosophies is which of these intensities is better at doing that.

In a podcast, Coggan generalized this question in a way I found helpful. He opined that between somewhere in Zone 2 through the top of Zone 4, all that mattered was the product of time and intensity. That is, if Zone 4 has twice the intensity of Zone 2*, 1 hour in Zone 4 has almost exactly the same training effect as 2 hours in Zone 2. My impression (again, from podcasts) is that Seiler would disagree. To explain why, I have to talk about blood lactate levels. What makes doing so confusing is that blood lactate can be used as the basis for an intensity zone system that is very different from the Hughes seven zone system I am using in this post. For that reason, I am going to refer to these as Lactate Brackets rather than Zones.

There are three Lactate Brackets, Bracket 1, 2, and 3  corresponding to low, medium, and high levels of blood lactate and thus intensity. Zone 2 lies in the low Lactate Bracket 1 whereas Zone 4 lies in the medium Lactate Bracket 2 and thus I think Seiler would argue that there is likely to be fundamental physiological differences between them. One consequence of such differences would be that a ride in the Lactate Bracket 2 will produce much more fatigue than a ride in Lactate Bracket 1, thus limiting the amount of training that can be done. Assuming Seiler is correct, given unlimited time to train, an athlete would be able to build up much more aerobic fitness riding in Zone 2 than they could riding in Zone 4 because fatigue would limit the Zone 4 rides long before it will limit Zone 2 rides.

One confounding factor in comparing Sweet Spot and Polarized training is that there tends to be a difference in the intended audience for Polarized and Sweet Spot training. Advocates of both will argue that theirs is the best approach for almost all racers but their primary targets seem to be different subsets of racers. Seiler mostly coaches full time athletes who have almost unlimited time to train. Many of the clients of Overton are amateur athletes who have to fit their training in around a job and family responsibilities. It may well be that Sweet Spot training is better if you have a limited time to train but that Polarized training is better if you have unlimited training time. Also, we must never forget individual variation. It is possible that one athlete may reach a higher peak performance with Sweet Spot whereas another may do so with Polarized Training.

So which is better, Sweet Spot or Polarized? I am far from an expert on the training literature, but so far I have not come across a study that answers that question in a way I find convincing. In a podcast, Dr. Coggan, who is an expert on the training literature, said more or less the same thing. In the first place, it is not even clear what the question is. Is it that which provides the greatest benefit if there are no constraints (e.g. if there is no limit on training time)? Is it that which provides the greater benefit to the greater number of athletes? Is it that which might be problematic for many athletes but which, if applied to the most gifted athletes, would produce the highest level of fitness? How long should the experiment run? For a year? For multiple years? For the length of an athlete’s career? In the second place, the chances of getting the resources needed to do the right experiments are effectively zero. So unless the differences are dramatic we will probably never know the answer. 

While investigating Sweet Spot training for this post, I noticed one additional, relatively unrelated aspect of Overton’s approach to training and that is extensive use of a training load model developed by Coggan. This model is most easily available as part of the commercial “Training Peaks” software package. This specific training load model is designed to use power meter data. However, Coggan’s model was originally based on the heart rate-based model of Dr. Edward Bannister, so it should be possible to do the same kind of tracking using heart rate data. As I listened to Overton, I became very jealous of how he could use this model to track the projected impact of each ride on his Form, Fitness, and Fatigue. Was there some way I could do the same thing? If so, would I have to purchase a power meter and the Training Peaks software or could I use a less expensive heart rate monitor and publically available software? As I looked at Coggan and Bannister’s models more closely, I found parts of them with which I disagreed and/or where my age and genetic background would require different parameters than these racer-targeted models used. Could I also customize these models? Although I had originally planned that this would be the last post in this series, I am now planning on writing one more post on these models at some point. Stay tuned.


^ https://fascatcoaching.com/blogs/training-tips/how-i-invented-sweet-spot-training
   https://fascatcoaching.com/blogs/training-tips/sweet-spot-training-with-dr-andy-coggan

* As I have previously blogged, I think the difference between Zone 4 and Zone 2 is greater than two-fold, but for the purposes of this illustration, it doesn’t matter, the principle is the same.

Thursday, September 2, 2021

VO2max, Health, and Fitness

An athlete improved his VO2max by 40% after changing his distribution of training intensities. In yellow is his old (bad) distribution. In red is his new (improved) distribution.


In the first post in this series, I made the argument that all of the most common measures of ride intensity: heart rate, power, blood lactate, oxygen consumption, even relative perceived exertion; were all different ways of measuring calories burned per hour. Perhaps one of the most direct measures of the rate of calories burned is oxygen consumption. Because oxygen is a gas, usually the best way to measure it is by volume, how many liters of oxygen are consumed per minute, a metric known as VO2 which stands for the Volume of O2, with 02 being the chemical symbol for the gaseous form of oxygen that we breathe. At rest, one consumes less oxygen and fewer calories per minute than when exercising. Of particular interest has been the maximum amount of oxygen it is possible for an athlete to consume when they are exercising as vigorously as possible. In the exercise community, this metric is named VO2max. In the scientific community, this exact same metric is sometimes referred to as VO2peak. This reflects the rigor of the scientific community, it recognizes that the value for VO2 measured can depend on how the measurement is made so that it is not really possible to know the maximum oxygen consumption but only the peak oxygen consumption measured in a particular experiment. (The MET, a metric popular in the health community, is more or less the same thing as VO2 and the equivalent of VO2max is max METs.) In the exercise community VO2max is often interpreted as “engine size”, the higher the VO2max an athlete has, the larger an “engine” they have. While it certainly is the case that an endurance athlete with a relatively low value of VO2max is unlikely to be competitive at the highest levels of their sport, it is also the case that the athlete with the highest VO2max will not necessarily win the race, other factors matter as well. In fact, more recent discussions deprecate the importance of VO2max in favor of other parameters such as threshold power, ability to quickly recover from a hard effort, etc.. In the health community, VO2max (aka VO2peak aka max METs) is often used as a stand-in for aerobic fitness; e.g. to conclude that subjects with higher VO2max live longer than those with lower VO2max.

Given the importance of VO2max, it has been a source of discouragement to the exercise community that it seemed very difficult to significantly improve VO2max by training. It seemed that every athlete was born with more or less the level of VO2max they are going to have throughout their lives. There is some variability from athlete to athlete in the trainability of VO2max . Some athletes cannot improve their VO2max at all, others can, but it is rare to find an athlete who can improve their basic VO2max by more than 15% or so. But how is this trainability determined? In my last post in this series, I mentioned the intensity of exercise traditionally used to improve various skills that an athlete might want to improve. According to the coach I used as an example, Coach John Hughes, Zone 6 of his 7 zone system is the intensity he recommends for improving VO2max. Specifically, he recommends working up to 2 to 4 repeats of 2 to 3 minutes at a heart rate greater than 105% of an athlete’s lactate threshold heart rate as a routine for improving VO2max. Thus, a typical experiment used to determine the trainability of VO2max is to measure VO2max on all subjects, have them engage in a training routine like that recommended by Coach Hughes for 6 weeks or so, and then measure it again. And this brings us to the very anecdotal, very problematic report which is the subject of this post.

Simplifaster is a company that makes exercise equipment. It stands to reason that they would prefer that athletes believe that training, in particular, training with Simplifaster’s equipment, improves performance. If it did not, why would anyone buy their equipment? Thus, a report on their website claiming that, with the right training, VO2max can be increased not just by 15% but by 40% would appear to present a conflict of interest. And yet, such a report is just what I am going to talk about. Worse yet, it describes an experiment on just one athlete, what would be called a “case study” in the medical community. Given these reservations, why am I blogging about it? It is because it is thought-provoking. Maybe we should not believe this report without confirmation, but maybe we should be inspired by it to question the conventional wisdom about the trainability of VO2max more than we have to date. The article is here.

The author of the article, Alan Couzens, is both an exercise scientist and a coach. Most of the article is a case study of one athlete he coached with the rest being some discussion about how typical this one athlete might have been. This athlete’s event was the Ironman Triathlon. His goal was to qualify for the Ironman World Championships. Qualifiers for that event typically have a VO2max of 65-70 ml/kg/min. This athlete trained by doing a lot of high intensity interval training at the intensity normally recommended for improving VO2max, and fully trained, he never exceeded a VO2max of 53 ml/kg/min. It might be argued that no further increase in VO2max was possible since he was already fully trained, but even assuming an improvement was possible by changing his exercise plan, a 15% increase, normally considered the maximum possible, would only give him a VO2max of 61, below typical qualifiers. At this point I want to be clear as to the relevant question. To the athlete, it is ‘Can I qualify for the World Championships?’ However, for the purposes of this post, the relevant question is ‘How much can this athlete improve his VO2max?’ This is a related but different question. What this coach did is exactly what most coaches would do, to replace some of this athlete's high intensity VO2max training with a large volume of relatively low intensity aerobic training and to maintain this program for three years. In year 1, his VO2max improved by 22%. In year 2, his VO2max improved by an additional 12%. In year 3, his VO2max improved by an additional 6% for a total improvement in his VO2max of 40% over three years. His final VO2max was 74.6 ml/kg/min, higher than the typical triathlon national champion, and in fact, he was able to qualify for the national championships. Finally, the author of this study noted that this athlete was not average, very few of the athletes he has coached improved their VO2max by 40%, but on average, they improved their VO2max by 24%, still significantly more than the 5-15% conventional wisdom would predict.

So, is Coach Hughes wrong about the benefit of Zone 6 training for VO2max? The author does not say that. Rather, he says that after an athlete has completed a long period of high volume/low intensity training, a small additional increase in VO2max can result from a brief period of high intensity (e.g. Zone 6) training. For the athlete who was the subject of this case study, the author suggests that the first 32% of improvement came from the large volume of low intensity training and the remaining 8% came from the small volume of high intensity training which was only done at the very end, after the low intensity training.

There is nothing new about the training plan that Couzens recommends, it is basically the same plan that every coach I have ever read recommends. Is it polarized training? For some time now, I have been following Stephen Seiler, the exercise scientist who coined the term polarized training, and I get the sense from him that what is of proven value in polarized training is less the high intensity side of that polarization and more the low intensity side. Thus, both polarized training and the training plan recommended in this report mostly just support the conventional wisdom of the coaching community that large amounts of low intensity exercise are an essential part of training for endurance sports.

Before switching focus from Fitness to Health, I need to insert a caveat. Everything up to this point has considered athletes whose current training program may not be optimal but who are relatively fit to begin with. This is very different from the situation faced by  the public health community who are interested in the benefits of exercise for health. Their studies are often on subjects who start out not exercising at all. Might such a person, one starting from a much lower level of fitness, have a greater potential for increasing their VO2max? I don’t have an answer to that question, but I do think about it while I am considering these health-oriented studies.

One health oriented study I have considered multiple times on this blog is one I call Gillen et al.  This study claimed that the health benefits of 1 minute of high intensity interval training (Zone 7) was equal to those of 45 minutes of low intensity aerobic exercise (Zone 2.) At the time I first reviewed this publication I had the following reservation:

Am I convinced that HIIT [High Intensity Interval Training] provides as much benefit as moderate exercise in extending longevity and improving health? … Not yet [because, although] after twelve weeks, HIIT and moderate exercise produce the same changes in VO2max, glucose tolerance, and muscle mitochondria, ... would these changes be equally maintained if the experiment were extended to a year or ten years?

The report which is the subject of this post would argue that my concerns are very justified, that if the experiment had been extended from 12 weeks to 3 years the results might have been very different, the low intensity group might have increased their VO2max much more than the high intensity group.

This report has different implications for another study I reviewed. This study compared over 100,000 patients who had taken treadmill “stress tests” as part of their medical care. These subjects were grouped by their max MET scores (equivalent to VO2max) and their risk of dying was followed over the next 4 to 13 years. The astounding result obtained was that the fittest 2.3% of the patients had a greater than 5-fold lower risk of dying than the least fit 25%. Compare this to the decrease in risk obtained by not smoking which is only 1.4-fold. Because this was an observational study, it was not possible to determine how much of that fitness was genetic and thus is out of the patient’s control and how much was the result of exercise. One hint as to the answer to that question came from a second paper I considered in that post which also looked at over 100,000 subjects and which was also an observational study but which asks its subjects how much they exercised. In this study, those who exercised the most had a 1.5-fold lower risk of dying, suggesting that much of fitness is genetic. Another way to ask this same question is to assume that VO2max can typically be increased by about 25% by exercising. How much would that help the treadmill scores of subjects with low fitness? In the treadmill study patients were put into five groups; the 25% with the lowest fitness, the next 25% with below average fitness, the next 25% with above average fitness, the top 25% with high fitness, and then a subset of this last group, the 2.3% with the highest fitness. In general, improving VO2max/max METs by 25% would move a subject up 1 group. This would decrease their risk of dying by about 1.4-fold. Thus, both of these approaches, an observational study that looked at exercise rather than fitness and a theoretical approach based on studies which measure how much VO2max can be improved provided very similar results; exercise can reduce risk of death about 1.5-fold whereas genetic factors that impact fitness can reduce risk of death by about 3-fold. This is a very weak conclusion based on a shaky chain of logic, but it is intriguing and to my mind begs for follow-up.

In the final post in this series I am going to look at the major competing theory to Polarized Training, and that is Sweet Spot training, a theory that seems to recommend the exact opposite to Polarized Training. Rather than avoid exercise which is in between low intensity and high intensity, such medium intensity training is the focus of Sweet Spot. Stay tuned.


Thursday, August 12, 2021

TRIMP, Intensity, and Fatigue


TRIMP, which stands for TRaining IMPulse, is a measure of training load, the amount of fatigue a ride generates. The longer the ride, the greater the fatigue. The more intense (harder, faster) the ride, the greater the fatigue. TRIMP is calculated by multiplying the length of a ride in minutes times a measure of intensity of that ride. The different curves shown above above illustrate different ways of estimating intensity. Lucia, Edwards, and Banister TRIMP are well known and are well described in the literature. Gillen and Hughes are defined by me and thus essentially unknown. I defined Gillen intensity in a previous post, and Hughes intensity in this post. The point of this post is to argue that I the well known versions of TRIMP significantly underestimate the amount of fatigue generated by high intensity rides. (Note that the above scale is a log scale; the differences illustrated are quite large.)


It Ain’t What You Don’t Know That Gets You Into Trouble. It’s What You Know for Sure That Just Ain’t So- Anonymous

How does one estimate the amount of fatigue a workout generates? The standard metric used by many coaches and academics is a metric known as TRIMP, which stands for TRaining IMPulse, a term that means training load. As is well known, training load produces fatigue in the short term and, when combined with recovery, increases fitness in the long term. In this post, I will only be considering the fatigue impact, and in that context, TRIMP is also synonymous with fatigue. 

TRIMP is not a single metric but rather a collection of different metrics. A TRIMP score is calculated by multiplying the minutes of exercise by the intensity of that exercise, which just kicks the can down the road: how does one determine intensity? The difference between the various TRIMP metrics comes from their use of different estimates of intensity. I wrote my previous post in this series, “​​Training Zones, Calories, Oxygen, and Power”, to provide the background needed to understand where estimates used by the more common versions of the TRIMP protocol come from; they come from the closely related metrics of heart rate, blood lactate, power, and the training zones derived from these metrics, all of which ultimately relate to calories burned per minute. In the absence of any information to the contrary, is it a reasonable guess that fatigue might be directly related to the rate at which calories are burned? Sure, why not? However, it is just as reasonable to guess that that it is not. What I am going to argue here is that there is information to the contrary, that the advice commonly given by coaches based on their real world experience provides a very different estimation of how fatigue relates to intensity than would be predicted by the amount of calories rides of different intensity consume. 

How do the common versions of TRIMP estimate intensity? Edwards TRIMP is based on a heart rate-based five zone system and uses the zone number as the measure of intensity. Lucia TRIMP uses a blood lactate-based three zone system and again uses the zone number as the measure of intensity. Banister TRIMP does not use training zones but rather  uses heart rate directly. In addition, it adds an exponential adjustment which reportedly was included to make it match lactate levels more closely. The effect of this correction is relatively small, however. There is also something called individualized TRIMP. I believe this represents a family of estimates with one source even using the term to to refer to Banister TRIMP^. The purpose of this post is for me to provide my own estimate of intensity which can be used in my own version of TRIMP, an estimate based on the actual training plans provided by Coach John Hughes.

This is not my first attempt to provide a different measure of Intensity. My first attempt was based on the paper I refer to as Gillen et al. This estimate was based on a 7 zone system, and I suggested that Zone 7 produced not 3.5 times the fatigue of Zone 2 but 45 times as much, that the estimates of intensity for Zone 2 and Zone 7 should be not 2 and 7 but 1 and 45. I think that fatigue generation and intensity is most definitely more complicated than that, that there may not even be a single number that fully represents each zone, but in the interest of not allowing the best be the enemy of good, such a single number representation is what I will be developing in this post not because I think it is perfect but because I think it is better than the other more commonly used estimates. To put this into perspective, in my last post I essentially used a multiplier of 1 for all zones because I lacked the zone data to do better. Had I been able to use the zone number multiplier I am now disparaging, that would have been better than what I did. I think this is why coaches sometimes recommend a zone number multiplier, it is simple so that their athletes might actually do it and it is better than nothing. In that spirit, I think there is an even better multiplier that coaches could add to their training zone charts that would be, if not perfect, an improvement over zone number (and just as simple). In fact, I think that multiplier is implicit in their more detailed training advice, and what I am going to do in this post is to tease that out for one publication of one particular coach, the one coach I am currently following, Coach John Hughes. The main theme of this post is going to be to compare what Coach John Hughes recommends to what he would recommend if it were true that Intensity was proportional to Training Zone Number (e.g. Load = Minutes x Zone Number.) 

Let’s imagine a healthy, young athlete who is a randonneur specializing in 200K brevets. Let’s imagine they select "Distance Cycling" by John Hughes and Dan Kehlenbach (hereafter referred to as Distance Cycling) as their training guide. This is the plan for preparing for a 200K brevet from Distance Cycling:


The numbers are the length of each day’s ride in minutes. The Green rides are ridden in Zone 1, the Yellow rides are ridden in Zone 2, and the Blue rides are ridden in Zone 3, but in what Zone should the red rides be ridden? To answer that question, our randonneur turns to another publication of Coach Hughes, “Intensity Training for Cyclists” (hereafter referred to as Intensity Training.) That book describes 6 training zones named Zone 1 through Zone 6. In addition to these six numbered Zones, it talks about 2 other zones named “Sweet Spot” and “Sprints”. Sweet Spot overlaps with the top of Zone 3 and the bottom of Zone 4 and Sprints are even more intense than Zone 6, they are a Zone 7 if you will. (This last point has confused me in the past so in some of my earlier posts I refer to Zone 6 when I should have referred to the Sprint zone, Zone 7.)  The imperfect but (hopefully) useful approach I will take is to look at how long the various workouts recommended by Coach Hughes are and from that, infer how much Fatigue per minute ridden Coach Hughes thinks are produced in each zone. There are some leaps in logic required to do that, and I will take you through those. To do so will require knowing a bit more about Coach Hughes’ training plan.

Intensity Training describes a periodized training plan consisting of fairly typical divisions into Pre-Season, Base, Build, and Main Season periods. The training plan diagrammed above describes the Build period which is what I will be focusing on in this post. This book is designed to be flexible, to adjust to a variety of riders and goals. Our hypothetical randonneur has the ambition of riding a 200K brevet as fast as possible and so uses the Coach Hughes’ “Performance Rider” plan which includes rides in all 8 zones. All rides between Sweet Spot and Zone 6 are done one day of the week, on the “red” day. Sprints (Zone 7) are interspersed within other rides, on any day except for rest (no ride) or active recovery (“green,” Zone 1) days. Rides in different training zones are designed to develop different cycling abilities. Which intensities your hypothetical randonneur will ride during their weekly “red” ride will depend on what abilities they are attempting to improve. Those abilities (along with the maximum recommended total time for each workout) are as as follows:
Sweet Spot: Increase Power                       Longest Workout: 40 minutes
       Zone 4: Increase Lactate Threshold     Longest Workout: 30 minutes
       Zone 5: Increase Racing Speed           Longest Workout: 20 minutes
       Zone 6: Increase VO2max                   Longest Workout: 15 minutes
       Zone 7: Improve Economy                   Longest Workout: 2.5 minutes

When our randonneur starts doing these higher intensity workouts, Coach Hughes conventionally has them start with fewer, shorter repeats and work up to more, longer repeats. the length of the workout is (the number of repeats) x (the length in minutes of each repeat). For each zone, he has a maximum number of minutes that an athlete reaches at the end of that progression. Since these Zones are swapped in and out of the same ("red") day in the schedule, one might infer that the maximum minutes, which is different for each zone, represents the same training load. Since Load = Intensity x Minutes, one can infer the relative Intensity by dividing the constant Load by the variable Minutes (e.g. Intensity = Load/Minutes). But is it true that all of these zones have an equivalent load? Here is what Coach Hughes says:

The harder the intensity, the more days of recovery you need between sessions. You may do two days of tempo workouts in a row if you can do a quality workout the second day. Allow at least one recovery day between sweet spot workouts and at least two days between sub-threshold, super-threshold, VO2 max and sprint workouts.” - Coach Hughes, in Intensity Training

Thus, taking Hughes at his word, it takes twice as long to recover from a Sweet Spot workout as it does from a Zone 3 workout and three times as long from Zones 4 through 7. The good news is that, by inference, the Zone 4 through 7 workouts each adds up to the same training load. The difference in recovery times between Sweet Spot (Zone 3.5, if you will) and Zone 4 is small and I will ignore it. (If I did include it, it would only increase the already large trend I am suggesting.)

What about Zones 1, 2, and 3? Zone 1 is only used for recovery rides, the goal of these rides is not to increase fatigue but to reduce it. The bad news is that means my approach cannot be used to estimate the fatigue generated by Zone 1 recovery rides. The good news is that there is no need to to do so, Zone 1 rides can be ignored as a source of fatigue. 

The Zone 3 ("blue") ride occupies a different slot in Coach Hughes training plan than the higher intensity ("red") rides so there is no reason to expect that it will generate the same amount of Fatigue as they do. The one clue we have is Coach Hughes statement that Zone 3 rides can be ridden two days in a row whereas the higher intensity rides require two to three days recovery between them. From that, we might conclude that the higher intensity ("red") rides generate two to three times the total fatigue as the Zone 3 ("blue") ride. The longest Zone 3 ride, both in Distance Cycling and in Intensity Training, is 90 minutes. If I were to argue that these 90 minutes generated only half the fatigue as the 40 minutes of total Sweet Spot (Zone 3.5, "red") ride, then I would have to conclude that the Intensity (Fatigue per Minute) of the Sweet Spot ride was 90 divided by 40 time 2 = 4.5 times as that of the Zone 3 ride. Compare this to the conventional TRIMP estimates that they are at most 1.25 times greater. At this point, I want to reiterate that I am aware of how tentative my argument is. I feel very strongly that the conventional TRIMP estimates significantly underestimate the Intensity of higher intensity rides but am much less sure exactly how much they do so. Thus, to be conservative, I am ignoring the two-fold multiplier and suggesting that a Sweet Spot ride has 2.25 times the Intensity as a Zone 3 ride.

The weakest link in my argument concerns the relative Intensity of Zone 2 (long, "yellow") rides and the higher Intensity rides. Again, they occupy a separate spot in Coach Hughes training plan so there is no basis for assuming they generate the same amount of Fatigue as the higher Intensity rides. I don’t know how to fix that so won’t try; for no good reason, I will assume that the long (“yellow”) ride generates the same amount of total Fatigue (Intensity x Time) as the Zone 3 (“blue”) and higher intensity (“red”) rides. The longest Zone 2 training ride Hughes recommends is 210 minutes.

The intensity I am calculating is relative. For convenience, I set the intensity of a Zone 2 ride equal to 1* and for each of the higher zones, the intensity given is how much harder that ride is per minute than a Zone 2 ride. Thus, for each zone, I calculate the intensity as the length of the longest ride at that intensity divided by the length of the longest Zone 2 ride and this is the results of that calculation:


In the first column is the training zone number. I have never seen a case where rides in Zone 1 are used to build fitness, and as noted above, this means I will not be using Zone 1 in my estimation, it will start with Zone 2. In the next column, I have given the relative Intensity implied by the recommendation that training load (which by definition equals Time multiplied by Intensity) be determined by multiplying ride time by zone number. It is useful to arbitrarily set Zone 2 to have an Intensity of 1 and thus Zone 4 will have a relative intensity of 2 and so on. That implied intensity is given in the next column, Zone Intensity. In the third column, named Hughes Minutes is the maximum number of total minutes in a workout (day) Coach Hughes suggests for each zone. Using my logic, I then convert this into a relative implied Intensity by arbitrarily setting Zone 2 to an intensity of 1 and then multiplying that by the ratio of minutes in Zone 2 / minutes in the Zone. Thus, for Zone 4, Hughes recommends a maximum of 30 minutes. In his overall training plan to prepare for a 200 kilometer long ride, he suggests a maximum ride length of Zone 2 rides of 400 minutes. 400 divided by 30 gives an intensity relative to Zone 2 of 13.3, much higher than the zone-number based estimate of 2. In a previous post, I used the data from Gillen et al. to do a similar estimate, and, for comparative purposes, that is shown in the final column. Gillen et al. only looked at Zone 2 and Zone 7 and so I put n.d. In the remaining positions of the table to indicate that the value was Not Determined.

Am I guilty of the straw-man fallacy? Does anyone actually estimate ride load by multiplying zone number times minutes? Every single scientific paper I have read that considers ride intensity uses one of the common versions of TRIMP to estimate that intensity. In a perfect world, those papers would have justified use of that metric, but in my opinion, they do not. Some studies do go as far as to show that TRIMP scores are going in the right direction and are better than nothing, points I do not dispute, but then go on to use them in a way that relies on them being quantitatively accurate which has not been demonstrated and which I believe is not true. As just one example, consider the publication, Vermeire et al. I reviewed about a year ago. That publication concluded that polarization of training was more important than training volume because they found that improvements in performance correlated with degree of polarization but not with TRIMP scores. (They looked at Banister, Edwards, Lucia, and individualized TRIMP.) Perhaps there would have been a correlation with TRIMP scores had they used a more quantitatively correct version of TRIMP.

In contrast, coaches give TRIMP very little if any attention. Rather, they provide concrete training suggestions, how long an intense effort should last (20 seconds, 1 minute, 10 minutes...) and how many times that effort should be repeated. What I am arguing for is to connect the scientific community with the wisdom of coaches. This is an approach that Dr. Seiler (father of periodized training) has adopted. He argues that laboratory studies are limited in what information they can provide and thus need to be supplemented with studies of the training approaches used by successful athletes and their coaches. 

If I were reviewing this post, my biggest complaint would be the lack of any experimental evidence that my approach is helpful. My response is to concede the point but then to note that this post is not intended as proof for anything but rather as a reality check and suggestion for future research. If the actual recommendations of coaches (the recommendations of Coach Hughes I used in this post are pretty typical) do not match the TRIMP protocols we are using, should we not worry about that? In short, I think coaches do not need improvements to TRIMP but rather can provide suggestions as to how to improve it. Exercise research scientists, on the other hand, often use TRIMP and thus would benefit from the improved versions of TRIMP that coaches can provide, based on their experience.


I confess that I understand individualized TRIMP least well of all of these and if you feel like you do understand it, please tell me about it in the comments. 
* Because of the way Banister TRIMP is calculated, and because that calculation generates a value of 0.9 for Zone 2, a value very close to 1.0, I didn't bother to correct Banister TRIMP numbers.

Thursday, July 15, 2021

What Do I Do Now?


[Next post I will return to my series of posts on the theory of Fatigue and Training Intensity. I interrupted that series both because I thought those remaining posts could benefit from more time and because I wanted to address my failure to prepare for a May metric century this year.]

Last post, I developed some tools for looking at my training data. I identified four similar routes that I ride frequently such that my average speed when I ride any one of these routes can be used interchangeably to assess my Form (my ability to ride fast and long which is increased by an improvement in my Fitness and decreased by a buildup of Fatigue.) I refer to rides on these four routes as Alpine-Like rides. For the purposes of this post, I assume my average speed on Alpine-Like rides is a measure of my Form. This may be a bit of an oversimplification but I believe it to be a useful approximation.

In my previous post I also developed some statistical techniques for more objectively examining ride data. In that post, I bemoaned my inability to prepare for The Art of Survival, a group ride I had hoped to attend last May. To understand that failure, I focused on my rides in the months before and used statistics to try to determine if my failure was truly due to a lack of Form (it was.) In this post I am zooming out to look at all the Alpine-Like rides I have completed since moving to California in September of 2017 to see what they can tell me about how I have been training and the impact of that on my Form. The graph at the top of this post shows my average speed on all 231 such rides completed between October 15, 2017 and May 31, 2021.

If you squint hard enough at that graph some trends might be apparent. What is crystal clear, however, is that there is a huge amount of day to day variability and the rides are very unevenly spaced over time. For example, note the very dense cluster of rides during the middle of 2018. It seems I really liked doing Alpine-Like rides back then! The latter has the potential to bias any statistical analysis by giving too much weight to that one time period. Primarily to correct that bias and secondarily to smooth the data a bit I have taken to grouping the data by month. All of the Alpine-Like rides in a given month are averaged and treated as one datapoint. The results of doing that are shown in the blue line in the next graph:


The red line on the graph is a running average of 3 months centered over each month to further smooth the data. When normalized and smoothed in this way, trends become much more apparent. It appears there was a slow increase in my Form after I got to California, but that towards the end of 2018, there was a more rapid decrease. Then, my Form started increasing around May of 2019, an increase that continued until the beginning of 2020 when my Form reached an all time high. That high was so dramatic that it caused me to (incorrectly) speculate that it was due to changes that my local bike shop made to my bicycle, a speculation about which I blogged. That rapid increase in Form was followed by an even more rapid decrease, then another increase followed by a decrease leading to the plateau of low Form that kept me from riding The Art of Survival last May, the plateau that was the subject of my last post.

Except for the calculation of averages, I have not used any statistics up to this point, all my conclusions are based on subjective eyeballing of the data. To a large extent that is because I am not sure how to apply statistics in this case. One significant complication in doing so is that I have looked at the data too much to be able to do a valid statistical analysis of it. This is a very counterintuitive fact about statistics to which many students object but which all professional statisticians agree is true. In order for a statistical analysis to be valid, you have to frame any hypotheses you want to test before ever looking at the data. You can divide the data in half, look at one half, develop hypotheses and then test them on the second half just so long as you don’t revise your hypotheses based on what you see in the second half of the data. What is so counterintuitive about this rule is that the apparently identical analysis done on the apparently identical first and second halves of the data yield invalid and valid results respectively. This turns out to be a consequence of the multiple testing problem I referred to in my last post. If you test 20 hypotheses all of which are wrong, on average one of them will test as statistically significant at the traditional P ≤ 0.05 level. That is, in fact, what P ≤ 0.05 means, there is a one in twenty (5%) chance that the observation is due to random chance. When one looks at a dataset, one's brain is rapidly testing an uncountable number of hypotheses and so will, using the subjective eyeball approach, find a few that look significant but are just due to random chance. You cannot even correct for this because you have no idea how many tests your subconscious brain did. The good news is that there is no reason that those same chance fluctuations will be present in the second dataset at which you have not looked. Unfortunately, I have no second dataset so all of my statistical analyses are suspect. That said, I feel like I am better off doing them than not so long as I do not overestimate my certainty. To further help minimize chance associations, I have started to use systematic analytical approaches to minimize the amount of cherry picking I am doing. One such systematic approach is to always analyze my data by calendar month rather than doing what I did in my last post, selecting an arbitrary group of rides that looked low and then testing that visually identified set with statistics.

That arbitrary calendar month grouping is far from a perfect solution, a month suffers from being both too long a time interval and also too short. It is too long because a lot can happen in a month, interesting transitions can be lost because of where they fall in the calendar. It is too short because some months don't have enough Alpine-Like rides to be statistically significant, a fact that will come up in the analyses below. However, it was the best solution I could think of to remove some of the subjectivity of my analyses.

To take advantage of my monthly summary data I used a 1 sample T-test to ask for each of the months I have been in California if my average speed on Alpine-Like rides for that month was significantly different than my overall average speed of 12.26 MPH. As I noted in my last post, this suffers from the multiple test problem. If you do enough comparisons, you will see "statistically significant" differences that are due just to chance. For that reason I will be using corrections to avoid that.

Since moving to California, I have ridden for 44 months. I decided that I wanted to have at least 4 rides in a month to compare its average speed to the overall average. When I removed months with fewer than 4 rides, there were 27 months left to compare and 5 of those were significantly slower or faster than average. The uncorrected probabilities that these differences are due to chance are P=0.00051, P=0.00173, P=0.00259, P=0.01265, and P=0.01298. I used the Holmes correction from The Primer of Biostatistics, the book I mentioned in my last post, to correct for the 27 comparisons I did to find those three apparently significant ones. When I did that, only the two most significant differences (one faster, one slower) remained significant at the P=0.05 level. The third was significant at the P=0.06 level, I cannot be 95% sure it is real but I can be 94% sure. For the last two I can be 75% sure they are real, more likely than not they are but they need to be taken with a grain of salt. There are other reasons for thinking that these 5 are all real (they are found in parts of the graph where the surrounding months are similarly fast or slow, for example) and similarly, it is almost certainly true that there are additional months that are significantly faster or slower as well but both noise in the data and lack of a sufficient number of observations prevent them from reaching statistical significance.

Interestingly, only one of the five months I found was faster than average. Based on my eyeballing of the data, that surprised me. When I looked at months that I expected to be faster, I found that, in most cases, the reason they were not found is that they contained fewer than 4 Alpine-Like rides. This suggested to me that fast rides might be due more to reduction in Fatigue from less riding than increase in Fitness due to more. However, just because I did fewer Alpine-Like rides doesn't mean I did less riding. There are many other routes I ride (though none of them often enough to be used to assess Form) so I added minutes ridden per month on all rides to my monthly summary data and plotted that against ride speed with the significantly faster or slower rides flagged:


The blue line is my average ride speed for the month, the dotted red line is my total minutes of riding for the month on all routes, and the significantly faster or slower months are flagged with a yellow dot. To my eye, there is no relationship whatsoever between minutes ridden and speed. Of course, minutes ridden is a massive oversimplification of training load; a minute in Training Zone 6 is entirely different from a minute in Training Zone 1 (6 is hard and fast, 1 is slow and easy.) I tag my rides as Easy, Pace/Long, and Brisk, and considered giving them different weights based on that but decided that was much too subjective and in the end I would just be playing with the data to get the answer I wanted. If I want to go to that level of sophistication, I think I would need to start riding with a heart rate monitor again. The reason I was willing to do the analysis that I did, assigning all rides equal weight, is that I am not specifically doing interval training at present, I ride all my rides at a similar more or less comfortable pace, so assigning them the same weight might make some sense. I am not totally comfortable with this argument, I think hillier rides leave me more tired and I have considered doing some sort of “feet of climbing” correction. Also, recovery rides I do on my trainer are, by design, much easier, though subjectively I feel that they do produce some Fatigue. However, for the moment, I think equal weight is the best I can do. 

The last graph is similar to the previous one except rather than flagging significantly fast or slow rides, I flagged the metric centuries for which I prepared:


The red dots are The Art of Survival, the gold dots are Golden Hills, the blue dot is a solo metric century I did here on the peninsula, and the green dot is not a metric century but flags the month in which I had my all time fastest Alpine-Like ride, ridden at 14.1 MPH. The most recent red dot flags is the only metric century for which I prepared but did not ride, the 2021 running of The Art of Survival. This figure strongly supports my decision not to attend that ride, my Form was at an all time low, much lower than for any of the metric centuries I did ride. Again, minutes of training doesn't appear to have anything to do with Form at the time of the ride. Things I do note by eyeball are that both times I rode Art of Survival and Golden Hills, my Form at the time of the Golden Hills ride was better. During the 2019 season, this trend seems to have continued. One month after the Golden Hills metric century I rode a solo metric century and my Form was even better. An accidental observation is that three months after that solo metric century, I ended up riding my fastest ever Alpine-Like ride.

I am at a loss to explain any of my observations above and in fact worry that there is a chicken and egg confusion in my thinking. Suppose my training does not determine my Form, but rather, my Form determines my training? Maybe when my Form is good I feel good and I ride harder. But then what is determining my Form? I confess I haven't a clue. I would like nothing better than to have a repeat of my 2019 season (even though my Art of Survival that year was utter misery) but haven't a clue how to do that. Maybe it is just out of my hands. Maybe I just have to take my Form as it comes, relax when it is low, and go for it when it is high. If so, that would again validate my decision to skip The Art of Survival this year. Still, I somehow have to decide what my weekly ride schedule should be. Last post, I mentioned that when I looked back at my subjective description of how I felt it didn't seem to be of much use, it didn't seem to correlate with Form or anything else. Maybe the problem is not with my subjective sense of Fatigue but how I record it. Maybe what I am doing is just fine, riding harder when I feel better and easier when I don't.

One change I am making, at least for the moment, is to ride a bit less in general and to relax what had been my fierce determination to ride at least 300 minutes a week and at least 4 rides a week. (obviously this is based on the assumption that I am riding too much rather than too little, an assumption I can neither justify nor refute, but which my "gut" tells me is true.) One thought that keeps coming back to me is that I am under-appreciating the impact that hills have on my training load. When I moved to California from Texas in 2017, my rides became much hillier. When I moved from San Carlos to Emerald Hills in 2020, they became even hillier. Where did I come up with the idea that I should always ride at least 300 minutes a week? The medical community recommends 300 minutes of Moderate aerobic exercise a week or 150 minutes of Vigorous aerobic exercise a week. The definitions of “Moderate” and “Vigorous” are many and varied. Based on those, I had been assuming that my rides represent a Moderate intensity of exercise. I have recently been reconsidering that and wondering if Vigorous intensity is a better description of my rides. More than that, there are the results in the paper Gillen et al. that I refer to so often. It argues that High Intensity Interval Training counts much more than even Vigorous exercise; that 6 or 7 minutes a week of all out sprinting would be enough to satisfy my medical needs. During the course of many of my rides (including the Alpine-Like rides) there are hills that really leave me panting. These climbs are probably less than the all out sprint evaluated by Gillen et al. but they are way beyond Vigorous. Thus, although it is hard to be sure exactly how to count my rides against the Medical recommendation, I am comfortable about relaxing the 300 minutes a week I had been trying for. As for the 4 ride a week recommendation of the coaches, to discuss all the reasons for reconsidering that would be a post in and of itself, but for many reasons, I am comfortable relaxing that minimum requirement as well. Will this reduction in riding help or hurt? Stay tuned to find out.

Tuesday, June 22, 2021

Apologies to Those Who Comment


Probably none of you are still here, probably none of you will ever see this, and yet I must apologize. I am sorry the comment you so generously wrote in response to one of my blog posts never appeared below that post, that it seemed to vanish into the blogosphere. That was not intentional, I promise you! The good news, such as it is, is that your comment has finally made it onto my blog.

When I started blogging in 2012, when someone would make a comment in response to one of my posts, I would get an email. I could decide to approve the comment which would then appear on my blog or not approve it and it would not. Mostly I approved comments, rejecting only those that clearly were advertisements having nothing to do with my post. I never got very many comments so when, sometime in 2018, I stopped getting them at all, I didn't notice.

Recently, I had an unrelated issue with Blogger. A draft post that I had been working on for months simply vanished one day and nothing I could do would bring it back. I searched the Internet for a way to get my content back and found that this was a known, replicable bug that Google (who maintains Blogger) is apparently ignoring. All of a sudden I became very concerned about protecting my content. In the past, there had been a way of backing up an entire blog with one click and and went looking for it and found that, apparently, that got silently removed. What I ended up doing to backup my blog is to go through post by post, all 200+ posts, and print them as PDF files. (I had many fewer drafts and saved those by cutting and pasting them into a file on my desktop computer.) However, before I gave up and took that approach, I went through every option and setting in Blogger looking for that missing backup capability, and in so doing, came across an option I had never seen before, an option called "Comments." Clicking on it, I found nine or ten comments on various posts, sitting in limbo, waiting for my approval. With no notification whatsoever, Google had stopped sending me emails so I never knew to look. I immediately approved them all, but for some of you, that was three years late. Sorry!

I have a love/hate relationship with Google (more love than hate.) When, in terror of losing my blog's content, to where did I paste my draft blog posts? To Google Docs, that's where. More than that, my entire digital history is backed up onto Google Drive. The biggest problem with Google software is that it is free. At that price, what right to I have to complain about anything? (I do pay for my Google Drive backup space.) Several weeks ago, I was fuming in response to another Blogger problem and ran across a post advising all future bloggers to avoid Google's Blogger software in favor of WordPress, a for-money product that the poster claimed was more reliable, feature-rich, and credible. A few years ago I had the opportunity of working with WordPress and think, if I could set my Wayback Machine to 2012 when I started my blog, I might advise myself to pay the money and take that approach. (Switching now would be much more problematic.) Realizing the absurdity of pasting my draft content into Google Docs to protect myself from the flaws in Google Blogger, I looked to see what it would cost me to go back to Microsoft Word and I have started to wonder if I should be taking another look at Apple Cloud for backup. But what assurance do I have that Apple or Microsoft or WordPress wouldn't let me down as well?

This post is meant to be an apology to those kind folks to commented on my blog only to have their comments (accidentally) ignored, not an assault on Google. There is no such thing as perfection in this world and certainly not in computerverse. I have been involved with computers since 1980 and for most of that time have felt that too much attention was being paid to feature novelty and not enough to stability and reliability. About twenty years ago, the IT staff at the university where I worked begged me to move all my emails onto their system, promising me they would preserve them forever. A few years later, at the advice of university attorneys, they deleted all but the last three years of my emails. When I complained bitterly, they merely shrugged. So Google is far from unique in struggling with these issues. Nonetheless, I continue to be frustrated with problems which, though not unique to Google, are problems to which Google is not immune. But mostly I wanted to explain to you, kind commenter, what went wrong.


Monday, June 7, 2021

What Is Truth?


Ride speed on my New Alpine and New Alpine CaƱada routes since my move to Emerald Hills. Ride speeds are in blue. The curve in red is a moving average of 8 rides centered around each time point.


A recurring theme on this blog is the impact of long term fatigue on my cycling. Back in 2012, 2013, and 2014, I was attempting to be a randonneur, a long distance cyclist who does rides of 200 to 1200 kilometers (km). During those years, I only managed two such rides, both at the shortest 200 km distance, and the biggest factor in my failure to complete more was long term fatigue. When I moved to California three and a half years ago, I decided to switch to shorter rides, 100 km rides known as metric centuries. My hope was that, unlike with the longer 200 km rides, I could do the 100 km rides more frequently, that as compared to the long term fatigue generated by training for and riding the 200 km rides, fatigue would be less of an issue with the 100 km rides. That has definitely been the case. However, less of an issue and not an issue are not the same thing. Although reduced, I believe that long term fatigue is still an issue for my 100 km rides. Or is it? Was fatigue ever the issue I thought it was? As a scientist, I always question my assumptions, there is a lot to question, and as much as I have discussed long term fatigue I still have a lot of uncertainty about it, an uncertainty that recently manifest itself yet again.

Let's start with some definitions: Form = Fitness - Fatigue. Form is what determines how fast I can potentially complete a ride, how long a ride I can complete, etc. If I haven't been training, my Fitness will be low and I will not be able to ride very quickly or very far. On the other hand, I might be very fit but completely exhausted from the training required to develop that Fitness, as a result my Fatigue is high, and so again, my Form and thus speed on a ride will be low. Also, factors other than cycling can cause Fatigue, other kinds of exercise (e.g. yard work), emotional stress, lack of sleep, illness, etc. Finally, this is not a quantitative equation. The biological mechanisms underlying Form, Fitness, and Fatigue are far from completely understood and there are no generally agreed-upon ways of measuring them and thus no units of Form, Fitness, or Fatigue. Thus, Form = Fitness - Fatigue is a conceptual equation. This post is about Form. To what extent my Form at any moment in time is due to Fitness or due to Fatigue has been and will be discussed elsewhere.

What inspired this post? As the COVID-19 pandemic has started to wane, I had hoped to restart my metric century group rides last month by riding the Art of Survival on May 29. However, I was not able to do that. I tried to replicate the very successful training plan I had developed for the 2019 Golden Hills metric century which includes a weekly 33 mile ride in the months before the event and then a 44 mile ride 4 weeks before and a 54 mile ride 2 weeks before. I had been successful at doing the 33 mile ride almost every week and completed the 44 mile ride on schedule, but there were warning signs. The two observations I have been able to use to measure my long term fatigue are how fast I ride and how I feel. By "how I feel" I mean do my legs feel sore and tired? Do I feel generally lethargic? Am I more grumpy than usual, do little things bother me more than they should? Am I unenthusiastic about starting a ride and do I find it an unpleasant slog once I go? As I attempted to train for the Art of Survival, that is how I felt. However, when I looked back at my subjective fatigue data, I found it unconvincing. I think I am just a pessimist, and it seems that my evaluation "how I felt" during the vast majority of my rides can be summarized as "I felt bad." Maybe I'm just old. Bill Clinton famously said that, after age 50, if you wake up in the morning and nothing hurts, you know you died during the night.

The second way I evaluate my readiness for a challenging ride is how fast I am riding. Currently, there are two routes I ride regularly enough that I can use them to assess my speed, named "New Alpine" and "New Alpine-CaƱada". I felt like my speed on these rides were slow. The central question of this post is, is this feeling of slowness because the rides were really slow, or was it a subjective illusion?

The New Alpine and New Alpine-CaƱada routes are similar to each other and similar to routes I rode back in the Fall of 2019 (routes named "Alpine" and "Alpine-CaƱada"), a time when I was riding well. and thus I might be able to compare speeds between now and then. But is not the speed of a ride dependent on how fast I choose to ride as much as my fatigue level? To some extent, yes. (I have blogged about that.) That said, I firmly believe that the speed at which I complete these rides is governed much more by my Form than by a conscious decision; I tend to ride them at a relatively constant subjective feel, not holding back but at a speed I feel I could maintain indefinitely. Thus, when I notice that, over several rides, the speed of these rides is lower than average, I take note. Unfortunately, this is still a subjective assessment. Yes, the speed of a ride is objective but what I consider fast and what I consider slow is subjective as is how many slow rides it takes before I conclude I am suffering from fatigue. I wanted to use statistical analysis to make this assessment less subjective and more quantitative, and that is the subject of this post.

I think I have a pretty good understanding of the theory of statistics but I am not a statistician; I lack the years of experience that made the statisticians I have worked with over the years so valuable. Also, the ride data I want to analyze is quite different in structure than the experimental data for which standard statistical tools were developed. Statistics is always as much of an art as it is a science and even the best of statistical approaches will not give informative results if the underlying data is not what it is assumed to be. With all those pitfalls in mind, I have taken a very redundant, conservative approach to my analysis, an approach using different tools to cross check I wasn't making a silly mistake and which I kept as close to first principles as I could so as to avoid the oh so common errors resulting from plugging data into the wrong formula or algorithm. Finally, I would mention the importance of thinking carefully about exactly what question I am answering with any specific analysis.

I noted above that I thought I rode four of my routes at speeds that were, on average, the same. Here is the data on those four routes:


Back when I first started riding the Alpine and Alpine-CaƱada routes, I predicted that, because the Alpine-CaƱada route was longer it would, on average, be slower, but that has not been my experience. Subjectively, I noted that my average speed on the two routes tended to be similar. On the other hand, looking at the small changes in the routes caused by my move from San Carlos to Emerald Hills, I predicted that, in the long run, the average speeds on the new routes and the old would be very close to the same. However, what might obscure that similarity in the short term is that my Fatigue seems to have been high for a lot of the time since the move. That illustrates a general complication of the analysis I am trying to do. Even assuming that ride speed is a simple reflection of my Form, they will not be randomly distributed over time, fast rides and slow rides will cluster, something I needed to keep firmly in mind as I did my analysis.

I could try to assess my Form using just the data from one of the four above datasets but there would be significant advantages if I could use them interchangeably, and thus my first statistical task was an analysis of variance to determine if I am formally justified in doing so. To perform Analysis of Variance (ANOVA), I used the formulas provided in "Primer of Biostatistics, Sixth Edition" by Stanton A. Glantz. (In general, that book was my guide for most of the statistics in this post. Hereafter, I will refer to this book as "Primer of Biostatistics.") Rather than use the table of critical values in that book, I used the Google Sheets FDIST function to calculate the P-value that the rides from the four routes were from the same "group", e.g. have the same average speeds. The equations I used required that the four groups to be compared have the same number of samples. The Alpine-CaƱada route I have ridden the fewest number of times, 29, so I had to take subsets of the other three so that I had four sets of 29 rides to compare. The normal way of doing that is to pick random samples. However, because of the data is clustered with respect to time, that is, the speed I ride on Monday tends to be correlated to the speed I ride on Wednesday much more than it is to the ride I did six months ago, I used matching instead. Since the set needing the most subsampling, the Alpine ride, is interleaved with the smallest set, the Alpine-CaƱada ride, I picked subsamples from the Alpine ride one week before or after an Alpine-CaƱada ride when possible, and when that didn't give enough subsamples, scattered the remainder as evenly over time as I could. In the case of the New Alpine and New Alpine-CaƱada datasets, they were only slightly too large (30 and 33 samples) and I had reason to believe that the most recent rides were outliers. In addition, I figured there was some virtue in having the rides I selected as close in time to the rides on the other two routes as possible. For those reasons, I picked the oldest 29 rides for each of these two routes. 

When I then did an ANOVA analysis on these four sets of 29 rides I determined that there was an approximately 60% chance they were all the same and a 40% chance that at least one was different. If I had been trying to prove that one of these rides was different (the most common use for this kind of analysis) I would have been disappointed that I failed the P < 0.05 test. Since I am hoping for the opposite, I should be happy, right? Well, as happy as I can be. In my opinion, there is no way to "prove" that rides on all four routes have the same average speed, I can only say I failed to prove otherwise. What my analysis does say is that there is no good reason, based on this data, to separate rides on these four routes from each other and thus provides justification for me to treat my ride speed on any of these four routes the same.

Does common sense agree with the above analysis? Common sense says that my average speed on these four rides cannot be exactly the same; after all, they are all different routes and those differences are almost certain to affect average speed. The question I really care about is this: "How big is the impact of route selection on average speed compared to the impact of Form?" Fortunately, statistics has a way to estimate the answer to that question, calculating confidence intervals. 

Using the same four subset of rides as I used for ANOVA, there are six possible pairwise comparisons I could make; Alpine vs Alpine-CaƱada, Alpine vs New Alpine, Alpine vs New Alpine-CaƱada, Alpine-CaƱada vs New Alpine-CaƱada, Alpine-CaƱada vs New Alpine, and New Alpine vs New Alpine-CaƱada. However, it would be a mistake to blindly make all six comparisons. If comparisons are done with the usual P < 0.05 criterion, there is a one in twenty chance that any difference declared significant will, in fact, be due to chance. With two comparisons, because there are now two chances to get unlucky, there is an almost 10% chance at least one of the two will be positive and by the time all six comparisons were made, that 5% risk has risen to about 26%. There are ways of correcting for that, but these corrections reduces the sensitivity of the analysis and so the right thing to do is to make as few comparisons as is necessary to answer the question at hand. I decided to make only one comparison, New Alpine vs New Alpine-CaƱada. The reason I picked that one is that I probably will never ride the Alpine and Alpine-CaƱada routes again (because my rides are door to door and the location of my door has permanently changed with my move from San Carlos to Emerald Hills) and so going forward, what I really want to know is if I am justified in pooling my rides on those two different routes. The 29 rides I used from the set of rides taken on the New Alpine route have an average speed of 12.06 mph, compared to those taken on the longer New Alpine-CaƱada route which have an average speed of 12.24 mph. The difference in those average speeds is 0.18 mph. When I revisit that a year from now when I have 50 or 60 rides on each route, is that difference likely to stay the same, get larger, or get smaller? How close is 12.06 mph to the true average speed I would see on the New Alpine route if I rode it many more times? Using the approach outlined in Chapter 6 of Primer of Biostatistics, I calculated that it is 95% certain that the real difference in average speed over these two routes is between -0.01 and +0.47 mph. That is, the New Alpine route may even be a bit faster than the New Alpine-CaƱada route, but is not likely to be more than 0.47 mph slower. Without belaboring the point, this suggests that any difference in speed between these two routes is unlikely to confound my attempts to determine my current Form using a random mixture of rides on them. Going forward, I will use rides on all four routes interchangeably and refer to them as the Alpine-Like routes and rides on those routes as Alpine-Like rides.

There is one more approach I would like to introduce before asking the question that inspired this blog post. Given the assumption (tested above) that speeds on all four of the Alpine-related routes can be used interchangeably, I have a total of 230 rides ridden over more than 40 months. This number is so large that I am going to consider it a statistical universe which allows me to use a different kind of test to ask questions like "Have my slow speeds over the last two months been slower than expected by chance?" That test is the one sample T-test, which determines if a set of measurements matches a known value. For example, given the above analysis, I am now claiming that I know that my average speed on any mixture of the Alpine routes is 12.26 mph. Using this approach, I don't have to take a small subset of those rides to compare to a small number of recent rides, I can compare those recent rides to the mean determined from the entire dataset. Unfortunately, Primer of Biostatistics does not include this version of the t-test, so I found an online calculator to do that for me:
I then recalculated using tools provided by Google Sheets as outlined in the following website:
Good news, the two approaches gave the same answer. The only thing left to do is decide which of my recent rides I should compare to that known average.

Visualization is always a good place to start an analysis, and so finally the graph at the top of this post becomes relevant. It displays the speed I rode an Alpine-Like ride for all the rides since moving to my new home in Emerald Hills. The actual ride speeds are in blue. The line in red is a running average of 8 of those ride speeds centered on each of those data points. My hypothesis based on that graph is as follows: During September and October of 2020 my speeds were increasing due to improved Fitness, that during November and December my speeds were decreasing due to a buildup of Fatigue, and since then my speeds have remained low because I failed to alter my training to allow me to recover from that Fatigue. In this post I will not attempt to determine if it is actually a buildup of Fatigue that caused my rides to be slow rather than lack of Fitness, I will simply ask: Are my recent rides truly slow or did I just have a few slow rides due to chance? There are statistical approaches for analyzing the rate at which ride speeds are increasing or decreasing, but I will not attempt to develop those for this post. That being the case, the easiest (and most relevant) rides to test are those rides that I am claiming were ridden at a unchanging low speed due to Fatigue, the rides between the beginning of February of 2021 and the middle of May. There are 24 rides between those dates with an average speed of 11.88±.46 mph. Using the one sample T-test, the chance that this is the same as the 12.26 mph average speed of all 230 Alpine-Like rides is ~0.004%, virtually non-existent. My recent rides have truly been slower than average.

How much slower have my recent rides been? The Standard Deviation for the 24 recent rides is 0.46 from which I can calculate that the Standard Error of the Mean (SEM) of those rides is 0.093 and so I can be 95% sure my true average speed between those dates was between 11.8 and 12.0 mph. Although statistically different, that is not very different in magnitude from my all time average of 12.26 mph. Sure, my ride speeds were really slower, but were they enough slower to matter? That is not a question of statistics, it is a question of biology and exercise science.

The biological rather than statistical significance of my slow rides is not a question for statistician but for an exercise physiologist (scientist) or a coach. I am unaware of any guidance from any scientist or coach on this precise question, and besides, every athlete is different and I am very different than the athletes scientists and coaches usually discuss, so I will attempt to answer this question myself. Let me start by asking what was the actual event that finally decided me I should not attempt to ride the Art of Survival this year? It was that I did not complete the training plan I had developed to get ready for this ride. Specifically, I failed to complete the last, 55 mile long training ride. This is similar to the reasons I failed to complete 200K brevets back between 2012 and 2014, it was not that I attempted the brevet and gave up along the way, it was as I approached the end of my training plan, I did not complete the longest rides in those plans. I have previously discussed ad nauseum why that might have happened and won't repeat that here, I will just take it as a fact. Back then, I noted that relatively small changes in my MAF test rides seemed to predict success or failure in preparing for a brevet. What I have accomplished in this post is to develop a California replacement for the MAF test. It is not that a 0.4 mph decrease in the speed at which I would have ridden the Art of Survival would have been the difference between success and failure, that would have only made a 5 hour ride less than 5 minutes longer, a matter of no consequence. It was that this decrease in speed on my standard rides is an indicator of the level of my Form. Attempting a physically challenging ride with such poor Form would, in my opinion, have been unwise. So yes, I believe that the relatively small decrease in average speed I have been riding recently is important, not in its own right, but as an indicator of my overall wellbeing.

Am I guilty of attacking a gnat with a sledge hammer? Have I belabored an obvious point? I don't think so. I have been eyeballing ride speed as an indicator of Form since I restarted cycling back in 2008 even though I knew that I might be deceiving myself. My tracking got even shakier when I moved to California, lost access to the Rice Track and MAF tests, and stopped using a heart rate monitor. Coaches recommend riding a test ride every month or so to access Form. The problem with that is that it is a single ride. Both intuition ("it was just a bad day") and statistics council us on the folly of basing a conclusion on one of anything. Back in Houston, I liked that the many MAF tests I rode for training gave me a statistically robust indicator of Form and by combining four of my most common rides I can now replicate that to some extent here in California. And yet, will all that, I was still eyeballing. This post is one of my iceberg posts where only a tiny fraction of the effort I put into it shows above the surface. I recently posted how I had made a copy of my training log in a relational computer database. I could not have done the analysis for this post without that database. I had to relearn (and in some cases learn) the statistics I needed to do this analysis. I tried many different approaches to analyzing the data as my originally fuzzy thinking about the questions I was asking became clearer. And finally, in the process of asking one specific question about my recent rides, I assembled statistical tools that will make it easier to use objective statistical analysis in place of eyeballing going forward. I may never figure out why I felt fatigued in the runup to Art of Survival 2021 or know if skipping it was the right decision, but at least now, one piece of that puzzle is real and not imaginary. As I have said many times before, I blog because it is fun, I do not deceive myself that it is any substitute for time on the bike, and it never is. I have never forgone even a single ride to work on this blog. And yet, I take satisfaction in knowing I am one small step closer to understanding why my cycling doesn't always go the way I'd like it to.